Evidence of change – Cycling on Green Lanes

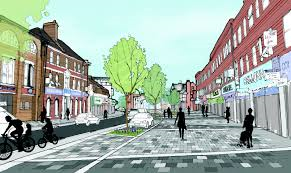
Enfield Council are committed to re-designing our streets to make walking and cycling a safe and accessible option for all our residents. This ambition is becoming a reality through extra investment that the Council have secured from Transport for London (TfL). The A105 Green Lanes project has seen a transformation of the road, increasing pedestrian crossings and installing safe cycle lanes in both directions. The Council have installed permanent cycle counters along the route, which 24 hours a day record the number of people cycling who pass through at various points along the route. Each month we publish a summary of this data, the latest figures are available here.
Our partners at TfL are also conducting their own monitoring of these projects, which includes periodic cycle counts. We have now received results of data that TfL collected in the spring of 2016, before the Green Lane cycle lanes were built and in spring 2018, once the cycle lanes were complete.
TfL recorded data at six locations along Green Lanes, and shows growth in cycling volume between Spring 2016 and Spring 2018 ranged between 32% and 85%. The average percentage growth across those six sites was 52%.
The percentage change between 2016 and 2018 at each of the six sites is:
- Green Lanes (Palmers Green Town Centre): 85%
- Green Lanes (St Monica’s Church): 66%
- Green Lanes (Firs Lane): 34%
- Ridge Avenue: 53%
- Village Road: 32%
- London Road: 44%
These counter locations are detailed in the map below (in accordance with the above numbered list).

On a typical Spring day in 2018, the bidirectional flow along the busiest section of the cycle track was 456 cyclists across the whole day (which TfL define as 6am to 10pm), up from 247 in 2016.
Our own cycle counts show that we have been seeing over 10,000 cycle journeys per month in the warmer months and more than 8,000 cycle journeys in the cooler months at Aldermans Hill in Palmers Green. On a typical Spring day in 2018 our own counters recorded a weekday average of 447 cycling journeys, which demonstrates consistency with this additional research conducted by TfL.
When Enfield won extra funding to invest in cycle lanes, the Borough had some of the lowest cycling levels in London. The investment was intended to address this, to increase more trips by bicycle in a Borough where the population is growing and where 30% of our car journeys are 2km or less. This data provides the evidence that the changes we are making are already having an impact, with more growth to follow.
By making these changes now, future generations will have more choices about how they travel, with the opportunity to choose sustainable options that benefit their own health and wellbeing without any negative effects to the rest of the community. In years to come, cycling will become a normal way of traveling short journeys for many people and we’ll see ever increasing numbers.
The A105 project is just one route, we expect continued growth across the Borough as our network expands and more people choose to cycle for some of their short local journeys.
If you want help learning to ride or boost your cycling confidence, book into our free Cycle Skills courses on our activities page and stay tuned for our new dockless bikes launching this summer across Enfield.


